Linux Hardware Debugging For Beginners
2017-10-30 - By Robert Elder
This article will focus on providing an overview of various Linux commands and tips that can be used to debug hardware issues on your computer. Since this article is targeted at beginners we won't go into a lot of depth on each subject. Therefore, it's worth noting that you can do much more with each of these tools than what is described here.
Some of the topics that are introduced include: Modules, Drivers, The GRUB Bootloader, hard disk mounting, init processes, kernel logs, and various other debugging commands.
WARNING: A number of ideas discussed in this article reference commands that could lead to loss of data if you don't use them properly. If you're a beginner, please exercise caution when using any commands that make use of the bootloader, hard disk formatting, partitioning etc.
General
Sometimes you'll want to view a list of the hardware that is currently in your computer. Each of the following commands can be used to obtain lots of detailed information about your hardware. Each command should remind you of the 'ls' command that list files. For example, 'lspci' is used to list information about PCI devices, 'lsblk' is used to list block devices, 'lscpu' is used to list CPUs, 'lshw' lists general hardware information, 'lsusb' lists information on USB devices and 'lsscsi' lists information on SCSI devices.
lspci
lsblk
lscpu
lshw
lsusb
lsscsi
Note that the output you get from the above commands will only contain your hardware if it is properly detected. There are various problems that can cause hardware to not be detected. In addition, hardware can sometimes also be misidentified as hardware from a different vendor.
Here's another variant of the 'lspci' command above that will be more verbose and print additional information including driver and module names associated with devices:
lspci -v
Finally, you can also use this command which prints out more information than you can probably handle:
hwinfo
One good reason to use this command would be to run it and pipe the results to a file where they could be sent to someone else for a bug report. This would let them review whatever details they need in order to debug a problem with someone else's hardware.
hwinfo > /tmp/my_report
Init Processes
An important part of understanding how your system works involves knowing what init process you're using. One popular init process is systemd. To find out if you're using systemd, run this command:
systemctl status
If you're not using systemd, you'll see something like 'command not found'. If you are you'll probably see something like this:
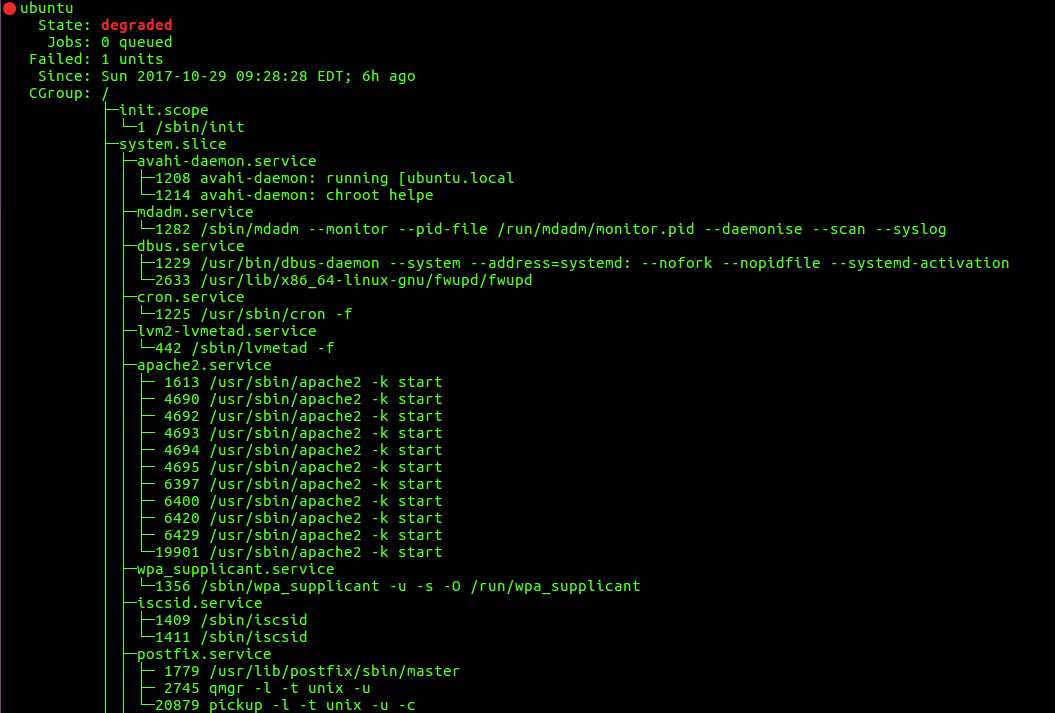
The above output shows the status of a number of services that were launched through systemd.
Since your init process is the first thing that starts after you boot the kernel, it is involved with launching a number of services, some of which will interact directly with your hardware. Therefore, if you're trying to debug something that seems like a hardware issue, it's probably a good idea to examine the status of each service that was launched by your init process to make sure it is functioning properly.
Dmesg
You can use this command:
dmesg
to show you any recent kernel diagnostic messages. Here is an example of some random messages that I see currently on my laptop (a bunch of stuff is broken that I haven't gotten around to looking into):
[    5.004764] snd_hda_codec_realtek hdaudioC0D0: autoconfig for ALC898: line_outs=1 (0x14/0x0/0x0/0x0/0x0) type:hp
[    5.004767] snd_hda_codec_realtek hdaudioC0D0:    speaker_outs=0 (0x0/0x0/0x0/0x0/0x0)
[    5.004768] snd_hda_codec_realtek hdaudioC0D0:    hp_outs=0 (0x0/0x0/0x0/0x0/0x0)
[    5.004769] snd_hda_codec_realtek hdaudioC0D0:    mono: mono_out=0x0
[    6.441596] iwlwifi 0000:02:00.0: L1 Disabled - LTR Enabled
[    8.006288] nvidia-modeset: Allocated GPU:0 (GPU-62bd1-7d-df-72-4250bb4) @ PCI:0000:01:00.0
[    8.006385] nvidia-modeset: Freed GPU:0 (GPU-62bd1-7d-df-72-4250bb4) @ PCI:0000:01:00.0
[    8.656307] vgaarb: this pci device is not a vga device
[    9.468958] [drm:intel_dp_link_training_clock_recovery [i915_bpo]] *ERROR* failed to enable link training
[    9.477564] [drm:intel_dp_start_link_train [i915_bpo]] *ERROR* failed to start channel equalization
[    9.564666] [drm:intel_dp_check_link_status [i915_bpo]] *ERROR* Failed to get link status
[   10.872948] [drm:intel_dp_link_training_clock_recovery [i915_bpo]] *ERROR* failed to enable link training
[   10.881531] [drm:intel_dp_start_link_train [i915_bpo]] *ERROR* failed to start channel equalization
These messages represent yet another source of information you can use to debug problems related to hardware. Often hardware problems that are detected by the kernel after booting up are added to the output of the dmesg command.
Boot Sequence Debugging
When your computer is booting up, a log of everything that happens is kept in /var/log/kern.log. Here is an example of stuff that I see in my kernel log right now:
Oct 22 09:18:02 ubuntu kernel: [    0.000000] Linux version 4.4.0-97-generic (buildd@lcy01-33) (gcc version 5.4.0 20160609 (Ubuntu 5.4.0-6ubuntu1~16.04.4) ) #120-Ubuntu SMP Tue Sep 19 17:38:18 UTC 2017 (Ubuntu 4.4.0-97.120-generic 4.4.87)
Oct 22 09:18:02 ubuntu kernel: [    0.000000] Command line: BOOT_IMAGE=/boot/vmlinuz-4.4.0-99-generic root=UUID=037c-947f-41ca-b00-f415be3e2 ro pci=nomsi
Oct 22 09:18:02 ubuntu kernel: [    0.000000] KERNEL supported cpus:
Oct 22 09:18:02 ubuntu kernel: [    0.000000]   Intel GenuineIntel
Oct 22 09:18:02 ubuntu kernel: [    0.000000]   AMD AuthenticAMD
Oct 22 09:18:02 ubuntu kernel: [    0.000000]   Centaur CentaurHauls
Oct 22 09:18:02 ubuntu kernel: [    0.000000] x86/fpu: xstate_offset[2]:  576, xstate_sizes[2]:  256
Oct 22 09:18:02 ubuntu kernel: [    0.000000] x86/fpu: xstate_offset[3]:  960, xstate_sizes[3]:   64
Oct 22 09:18:02 ubuntu kernel: [    0.000000] x86/fpu: xstate_offset[4]: 1024, xstate_sizes[4]:   64
...
Oct 22 09:18:02 ubuntu kernel: [    0.021723] ACPI Exception: AE_NOT_FOUND, During name lookup/catalog (20150930/psobject-227)
Oct 22 09:18:02 ubuntu kernel: [    0.021959] ACPI Exception: AE_NOT_FOUND, (SSDT:xh_rvp11) while loading table (20150930/tbxfload-193)
Oct 22 09:18:02 ubuntu kernel: [    0.031695] ACPI Error: 1 table load failures, 9 successful (20150930/tbxfload-214)
Oct 22 09:18:02 ubuntu kernel: [    0.032138] Security Framework initialized
If you ever have problems with any of your hardware devices in Linux, it's a good idea to review the contents of this log file to see if there are any error messages related to the device you're having problems with. This log is very verbose and in practice you'll often see some error messages or warnings that don't necessarily require that you do anything about them.
In addition to the kernel log, it can also be useful to change your GRUB settings so that you can see kernel messages on the screen as your computer tries to boot up. This can be done by making sure that the 'quiet' and 'splash' settings are removed from your GRUB configuration. This will be discussed in more detail later in this article.
Drivers And Modules
If you spend any amount of time debugging hardware devices on your Linux machine, you'll eventually encounter the concept of drivers and modules. The difference between drivers and modules is a bit confusing and not well defined, but I'll give a shot at describing the difference between the two:
A driver is just any piece of code that takes care of the low-level interfacing with the specific hardware device you need to interface with. Drivers may or may not need to operate in a highly privileged mode to execute special hardware-specific instructions, or they may do any number of low level operations that interact with your hard drive, keyboard, video card etc.
A Linux kernel module is a package of code that can be added and removed from the kernel at run time. Often, but not always, a Linux kernel module is actually a driver. Therefore if you're just a beginner at Linux, it's probably OK, to suggest that 'modules and drivers are the same thing'. As you learn more, you'll become more aware of their differences. Here is a discussion that talks more about the difference between Linux kernel modules and drivers.
You can use the command
lspci -v
to show verbose information about your devices. This output will list the kernel modules that can be used with each device, and it will also list the current driver that is in use for each device if applicable.
If you want to see all possible kernel modules that exist on your system, you can use this command:
lsmod
The above command will list all modules that are available, including those that are not actually loaded.
You can also see module information viewing the contents of '/proc/modules':
cat /proc/modules
If you want to see where the Linux kernel modules are stored on disk, you can check '/lib/modules'. This folder will contain folders for each version of the kernel. If your machine has been through a lot of kernel updates, then you'll probably see many folders here.
For example, here is a command that will show me all modules that were enabled with my kernel version 4.4.0-97:
find /lib/modules/4.4.0-97-generic/ | egrep "*.ko"
Note that you'll probably have to replace '4.4.0-97-generic' with something else unless you have that kernel version. Here is a sample of the output that I see from this command:
...
/lib/modules/4.4.0-97-generic/kernel/lib/lz4/lz4_compress.ko
/lib/modules/4.4.0-97-generic/kernel/lib/lz4/lz4hc_compress.ko
/lib/modules/4.4.0-97-generic/kernel/lib/test_firmware.ko
/lib/modules/4.4.0-97-generic/kernel/lib/lru_cache.ko
/lib/modules/4.4.0-97-generic/kernel/lib/libcrc32c.ko
/lib/modules/4.4.0-97-generic/kernel/lib/crc-itu-t.ko
...
If you want to learn information about a specific kernel module, you can use the 'modinfo' command with a module name as an argument. For example, let's learn more about a module called 'nvidiafb' that I see in the output of the 'lspci -v' command:
modinfo nvidiafb
Here is the result I see from the above command:
filename:       /lib/modules/4.4.0-97-generic/kernel/drivers/video/fbdev/nvidia/nvidiafb.ko
license:        GPL
description:    Framebuffer driver for nVidia graphics chipset
author:         Antonino Daplas
srcversion:     258EB68CBB3428
alias:          pci:v000010DEd*sv*sd*bc03sc*i*
depends:        vgastate,i2c-algo-bit,fb_ddc
intree:         Y
vermagic:       4.4.0-97-generic SMP mod_unload modversions
parm:           flatpanel:Enables experimental flat panel support for some chipsets. (0=disabled, 1=enabled, -1=autodetect) (default=-1) (int)
parm:           fpdither:Enables dithering of flat panel for 6 bits panels. (0=disabled, 1=enabled, -1=autodetect) (default=-1) (int)
parm:           hwcur:Enables hardware cursor implementation. (0 or 1=enabled) (default=0) (int)
...
Finally, it is also useful to know that you can add and remove modules at run time using the 'modprobe' command. For more information, run:
modprobe -h
/dev
The '/dev' directory is special in that it contains file-like representations of many devices in your system. If you run the following command:
ls -latr /dev
you will see something like the following:
...
brw-rw----   1 root disk        8,  16 Oct 28 10:31 sdb
crw-rw-rw-   1 root root        1,   8 Oct 28 10:31 random
crw-rw-rw-   1 root root        1,   3 Oct 28 10:31 null
crw-rw-rw-   1 root root        1,   5 Oct 28 10:31 zero
crw-rw-rw-   1 root root        1,   9 Oct 28 10:31 urandom
crw--w----   1 root tty         4,  31 Oct 28 10:31 tty31
crw--w----   1 root tty         4,  30 Oct 28 10:31 tty30
crw--w----   1 root tty         4,  60 Oct 28 10:31 tty60
crw--w----   1 root tty         4,   6 Oct 28 10:31 tty6
crw-------   1 root root       89,   7 Oct 28 10:31 i2c-7
crw-rw-rw-   1 root root      195, 254 Oct 28 10:31 nvidia-modeset
crw-------   1 root root        5,   1 Oct 28 10:32 console
...
each of these lines represents a 'file' that can be interacted with in many of the same ways as a normal file could be (with some exceptions). For example, there is a special 'device' that can be used to generate random numbers. You can read from this device just like you would read from any file with the following command:
xxd /dev/urandom | head -n 3
and the result of this command is:
00000000: efc7 1226 97e2 924d 4ceb 2d34 350a 4bf5  ...&...ML.-45.K.
00000010: 3222 cd8e 4b41 1bda 0b57 1719 f65e 59b2  2"..KA...W...^Y.
00000020: 3516 f199 a137 bb09 dc1c d1e4 8704 6f20  5....7........o
You could even use techniques like this to open your entire hard disk as a file (often as '/dev/sda' or '/dev/sdb') and write to it. However, if you do this you'll need root permissions, and you'd better know what you're doing otherwise you're likely to make your system unbootable!
Something else you should take notice of from the command above is the major and minor numbers:
crw--w----   1 root tty         4,  60 Oct 28 10:31 tty60
crw-rw-rw-   1 root root      195, 254 Oct 28 10:31 nvidia-modeset
crw-------   1 root root        5,   1 Oct 28 10:32 console
These major and minor numbers appear where you would otherwise see a number to indicate file size for a regular file. Generally, each major number identifies the driver associated with that device. One driver can control multiple devices, each of which will be assigned a different minor number. Here is a link with a few more details on major and minor numbers. Also note that the 'c' in the above output indicates that the device is a character device (and not a block device).
You can often go the other way and start with the major minor number pairs and get the device names using information located in '/sys/dev/block/' or '/sys/dev/char/' depending on whether the device is a block or character device. For example, we previously saw that on my machine the device 'console' had major number 5 and minor number 1. If I run the following command:
cat /sys/dev/char/5\:1/uevent
the result on my machine is:
MAJOR=5
MINOR=1
DEVNAME=console
which includes the original device name that was found in '/dev'.
Knowledge of these major and minor numbers is relevant in understanding how devices 'appear' in '/dev' after you plug them in. Modern Linux uses something called 'udev' to manage how devices are detected and how the actual device nodes get created and added in '/dev'. Here is a link that describes more about how udev works and what it does.
Networking
One of the commands that I use very frequently to check my IP address or connectivity is:
ip addr show
On my machine this command gives me:
1: lo: <LOOPBACK,UP,LOWER_UP> mtu 65536 qdisc noqueue state UNKNOWN group default qlen 1
    link/loopback 00:00:00:00:00:00 brd 00:00:00:00:00:00
    inet 127.0.0.1/8 scope host lo
       valid_lft forever preferred_lft forever
    inet6 ::1/128 scope host
       valid_lft forever preferred_lft forever
2: enp3s0: <NO-CARRIER,BROADCAST,MULTICAST,UP> mtu 1500 qdisc pfifo_fast state DOWN group default qlen 1000
    link/ether d8:38:8a:10:2f:49 brd ff:ff:ff:ff:ff:ff
    inet 169.254.9.73/16 brd 169.254.255.255 scope link enp3s0:avahi
       valid_lft forever preferred_lft forever
3: wlp2s0: <BROADCAST,MULTICAST,UP,LOWER_UP> mtu 1500 qdisc mq state UP group default qlen 1000
    link/ether 33:2b:ff:14:99:cf brd ff:ff:ff:ff:ff:ff
    inet 192.168.0.165/24 brd 192.168.0.255 scope global dynamic wlp2s0
       valid_lft 577314sec preferred_lft 577314sec
    inet6 f8e0::6333:1180:87ea:ffc1/64 scope link
       valid_lft forever preferred_lft forever
In the above output, the 'enp3s0' device is the ethernet network interface (where the blue internet cable thingy plugs in). Since I don't have an ethernet cable plugged in that is connected to my router, there is no IP address associated with the ethernet interface. The 'wlp2s0' device is my wireless network interface. I am currently connected to the router over WIFI though, and you can see that the router assigned my computer IP 192.168.0.165 on the local area network. The 'lo' device is the loopback interface.
There are a number of other useful things you can see from using the 'ip' command, but I won't cover them here. It should be noted that there is an older command known as 'ifconfig' that does a similar function but ifconfig is actually deprecated and you're better off using the 'ip' command which is more powerful.
Another useful command that you can use to list out all the nearby WiFi networks is:
sudo iw dev wlan0 scan
In the above command you need to replace 'wlan0' with the name of your WiFi Device. For me, I need to type:
sudo iw dev wlp2s0 scan
If you just want to see the names of the WiFi networks you can pipe the output through grep:
sudo iw dev wlan0 scan | grep SSID
The 'ping' command can be used to determine the latency and reachability between you and another computer. This can be extremely useful when debugging which piece of networking hardware is not working:
ping 127.0.0.1    #  If this fails then networking on your local computer is broke
ping 192.168.0.1  #  If this fails then your computer isn't able to talk to your local router (assuming router IP is 192.168.0.1)
ping 8.8.8.8      #  If this fails your computer doesn't have any direct or indirect connection to the internet (8.8.8.8 is a Google DNS server).
Normally, the output of ping will look something like this:
PING 8.8.8.8 (8.8.8.8) 56(84) bytes of data.
64 bytes from 8.8.8.8: icmp_seq=1 ttl=59 time=25.4 ms
64 bytes from 8.8.8.8: icmp_seq=2 ttl=59 time=24.0 ms
64 bytes from 8.8.8.8: icmp_seq=3 ttl=59 time=21.5 ms
64 bytes from 8.8.8.8: icmp_seq=4 ttl=59 time=28.2 ms
64 bytes from 8.8.8.8: icmp_seq=5 ttl=59 time=16.5 ms
^C
--- 8.8.8.8 ping statistics ---
5 packets transmitted, 5 received, 0% packet loss, time 4005ms
rtt min/avg/max/mdev = 16.568/23.182/28.257/3.946 ms
If your connection to the IP you're pinging is broke you might see something like this:
PING 8.8.8.8 (8.8.8.8) 56(84) bytes of data.
From 169.254.9.73 icmp_seq=1 Destination Host Unreachable
From 169.254.9.73 icmp_seq=2 Destination Host Unreachable
From 169.254.9.73 icmp_seq=3 Destination Host Unreachable
From 169.254.9.73 icmp_seq=4 Destination Host Unreachable
From 169.254.9.73 icmp_seq=5 Destination Host Unreachable
From 169.254.9.73 icmp_seq=6 Destination Host Unreachable
^C
--- 8.8.8.8 ping statistics ---
7 packets transmitted, 0 received, +6 errors, 100% packet loss, time 6025ms
A great tool for determining what ports are open on your local machine (or a remote machine) is nmap:
nmap
This tool can be used to identify what ports and services are open on a particular machine. Here is a command to scan for open ports on your own computer:
nmap localhost
and here are the results:
Starting Nmap 6.40 ( http://nmap.org ) at 2017-10-29 17:27 EDT
Nmap scan report for localhost (127.0.0.1)
Host is up (0.00010s latency).
Not shown: 998 closed ports
PORT    STATE SERVICE
80/tcp  open  http
631/tcp open  ipp

Nmap done: 1 IP address (1 host up) scanned in 0.09 seconds
The above output shows that there are only two open ports visible on a simple scan: port 80 where a web server is hosted, and port 631 where a remote printing daemon is hosted.
Another useful command is traceroute which will show you all of the computers between you and another computer over a network such as the internet. This is useful because it can tell you what hardware a message from your computer has to pass through in order to get to its destination. Here is an example of performing a traceroute to Google's DNS server:
traceroute 8.8.8.8
and here are the results:
traceroute to 8.8.8.8 (8.8.8.8), 30 hops max, 60 byte packets
 1  216.182.224.118 (216.182.224.118)  11.900 ms 216.182.224.116 (216.182.224.116)  11.849 ms 216.182.224.172 (216.182.224.172)  19.325 ms
 2  100.66.8.230 (100.66.8.230)  14.864 ms 100.66.12.46 (100.66.12.46)  21.087 ms 100.66.8.68 (100.66.8.68)  15.428 ms
 3  100.66.14.38 (100.66.14.38)  16.412 ms 100.66.11.142 (100.66.11.142)  17.507 ms 100.66.10.46 (100.66.10.46)  12.613 ms
 4  100.66.6.9 (100.66.6.9)  17.466 ms 100.66.6.29 (100.66.6.29)  49.260 ms 100.66.7.141 (100.66.7.141)  17.693 ms
 5  100.66.4.61 (100.66.4.61)  19.457 ms 100.66.4.19 (100.66.4.19)  19.761 ms 100.66.4.53 (100.66.4.53)  18.131 ms
 6  100.65.10.65 (100.65.10.65)  0.533 ms 100.65.9.129 (100.65.9.129)  0.450 ms 100.65.11.1 (100.65.11.1)  0.387 ms
 7  205.251.245.235 (205.251.245.235)  1.776 ms 52.93.24.0 (52.93.24.0)  29.803 ms 205.251.244.200 (205.251.244.200)  1.356 ms
 8  52.93.24.33 (52.93.24.33)  1.301 ms 52.93.24.21 (52.93.24.21)  2.078 ms 54.239.109.44 (54.239.109.44)  17.698 ms
 9  54.239.108.198 (54.239.108.198)  1.349 ms  16.498 ms 54.239.108.130 (54.239.108.130)  25.445 ms
10  54.239.108.213 (54.239.108.213)  1.407 ms 72.14.212.130 (72.14.212.130)  1.962 ms 54.239.108.145 (54.239.108.145)  1.653 ms
11  108.170.246.1 (108.170.246.1)  1.514 ms 72.14.203.120 (72.14.203.120)  1.279 ms  1.278 ms
12  * * *
13  209.85.254.127 (209.85.254.127)  1.571 ms google-public-dns-a.google.com (8.8.8.8)  1.375 ms 209.85.253.61 (209.85.253.61)  1.855 ms
Hard Disk
A common thing to do is check if any of your hard disks are full. You can do that with the 'df' command:
df
Here's the result on my machine:
Filesystem     1K-blocks      Used Available Use% Mounted on
udev             8141388         0   8141388   0% /dev
tmpfs            1633448      9672   1623776   1% /run
/dev/sdb1      122940436  65279988  51392392  56% /
tmpfs            8167224     71884   8095340   1% /dev/shm
tmpfs               5120         4      5116   1% /run/lock
tmpfs            8167224         0   8167224   0% /sys/fs/cgroup
/dev/sdc2      942078208 252939556 641260732  29% /mnt
tmpfs            1633448        60   1633388   1% /run/user/1000
The above command shows how to check the amount of space used for files, but a common problem is to have older kernel version take up a lot of inodes, and in this case you can have 'disk full' errors on /boot when you try to upgrade (this happens often in Ubuntu). In these cases you might see that your disk space is well under 100% when using 'df', but you should also use:
df -i
to show inode usage. Older kernel headers will often take up many inodes but not much space since they're mostly thousands of small files that each require an inode.
Filesystem       Inodes  IUsed    IFree IUse% Mounted on
udev            2035347    553  2034794    1% /dev
tmpfs           2041806    886  2040920    1% /run
/dev/sda1       7815168 626440  7188728    9% /
tmpfs           2041806     87  2041719    1% /dev/shm
tmpfs           2041806      9  2041797    1% /run/lock
tmpfs           2041806     16  2041790    1% /sys/fs/cgroup
/dev/sdb2      59834368 796290 59038078    2% /mnt
tmpfs           2041806     30  2041776    1% /run/user/1000
There is a program called 'fdisk' that is used for formatting and partitioning disks that I often find myself using to list out all disks and partitions even if they're not mounted. Note: Be very careful to make sure you know what you're doing when you run fdisk because you can easily re-format your disk and destroy data if you don't pay attention! Here is a non-destructive command that will list all disks and partitions:
sudo fdisk -l
Of course, as mentioned before you can use fdisk to format disks and create various types of partitions: swap, bootable, non-bootable etc.
Once you have properly formatted your hard disk and created a partition, you can use the 'mke2fs' command to create a filesystem on the partition.
If you ever find yourself trying to get an existing partition to show up automatically at boot, you'll need to know about the '/etc/fstab' file. Here is mine:
# /etc/fstab: static file system information.
#
# Use 'blkid' to print the universally unique identifier for a
# device; this may be used with UUID= as a more robust way to name devices
# that works even if disks are added and removed. See fstab(5).
#
# <file system> <mount point>   <type>  <options>       <dump>  <pass>
# / was on /dev/sda1 during installation
UUID=037d5ae-97f-4ca-b00-fbe3415e2 /               ext4    errors=remount-ro 0       1
UUID=c04d9c5-d2a-4fd-8e7-5d9535f3c /mnt               ext4    errors=remount-ro 0      2
# swap was on /dev/sdb1 during installation
UUID=fda32f0-7da-492-d4c-fefd11d46 none            swap    sw              0       0
This file contains information that associates the hardware automatically with a mount point during the boot process. There are various different versions of the syntax for this file that you can look up online. If you change this file, be careful to not make mistakes, otherwise you may end up causing the boot process to fail.
If you don't add an entry to '/etc/fstab' to mount a partition at boot time, you'll need to do so manually with the 'mount' command. You can also un-mount with the 'umount' command. Note that the command is spelled umount and NOT unmount.
It is possible that when you try to unmount it you'll get an error that says 'device is busy'. You can run the command
lsof /path/of/mount/directory
where '/path/of/mount/directory' is the directory where the partition is mounted (this directory is visible in the output of the 'df' command). After you run this command, you'll be presented with a list of applications that are using the device and causing it to be busy. Often, I'll get the 'device is busy' message when I leave a shell open in a directory that is located on the device in question.
If you ever need to find the size of files on a disk, you can use this command:
du -k /some/directory
You can also pipe this into sort to find the largest files:
du -k /some/directory | sort -n
Finally, there is also a command-line program called fsck that you can use to check for filesystem consistency.
Memory
Here is a command to check free:
free
and this is the result on my machine:
              total        used        free      shared  buff/cache   available
Mem:          15951        1942       11694          80        2315       13528
Swap:         19072           0       19072
You can also check the contents of '/proc/meminfo:
cat /proc/meminfo
and this is the result on my machine:
MemTotal:       16334452 kB
MemFree:        11854128 kB
MemAvailable:   13777136 kB
Buffers:          514872 kB
Cached:          1583972 kB
SwapCached:            0 kB
Active:          3021376 kB
Inactive:         935736 kB
...
Dirty:               236 kB
Writeback:             0 kB
AnonPages:       1846112 kB
Mapped:           535156 kB
Shmem:             87032 kB
Slab:             322700 kB
SReclaimable:     256268 kB
SUnreclaim:        66432 kB
KernelStack:       10432 kB
PageTables:        46096 kB
NFS_Unstable:          0 kB
...
Hugepagesize:       2048 kB
DirectMap4k:      264920 kB
DirectMap2M:     6977536 kB
DirectMap1G:    10485760 kB
The output from '/proc/meminfo' is a bit more detailed and show a number of metrics that dive deep into the performance of virtual memory on your machine.
CPU
If you want to know what CPU you have, you can do:
cat /proc/cpuinfo
Here is part of the result on my machine:
processor	: 7
vendor_id	: GenuineIntel
cpu family	: 6
model		: 94
model name	: Intel(R) Core(TM) i7-6700HQ CPU @ 2.60GHz
stepping	: 3
microcode	: 0x84
cpu MHz		: 2154.140
cache size	: 6144 KB
physical id	: 0
siblings	: 8
core id		: 3
cpu cores	: 4
apicid		: 7
initial apicid	: 7
fpu		: yes
fpu_exception	: yes
cpuid level	: 22
wp		: yes
flags		: fpu vme ....... hwp_epp
Note that you'll get what looks like repeated results if you have a multi-core processor. Each result represents one of the cores.
There are a few circumstances where checking for your processor model number like this can be very useful. One such case is a situation where a piece of software was giving me an 'illegal' instruction error, but only on some EC2 instances, even when the EC2 instances where all of the same type!
Sound
Here is a command you can use to list all sound capture devices:
arecord -l
Here is a command you can use to list all PCI devices that contain the word 'audio':
lspci | grep -i audio
If you have alsa-utils installed you can list all devices that aplay knows about:
aplay --list-devices
Another useful option is to list all Linux kernel modules that contain the letters 'snd':
lsmod | grep snd
Video
You can often use the following command to list out your video devices:
lspci | egrep -i "3d|vga"
Although, in some cases you may have to look through the full output of 'lspci' to find your video device.
If you ever try to boot up your Linux system and you only see a black screen, the first thing you should do is try:
CTRL + ALT + F6
Running the above command will change your virtual terminal to VT 6 where you should see a prompt that will let you log in and manage the system through the command-line. By default, your graphical interface is displayed on VT 7, and by switching to any of VT 1,2,3,4,5,6 you can access a terminal session even if your graphical session is not working.
If you ever do get into one of these situations with a broken graphical session, you should probably check the log file in '/var/log/kern.log'. You should also check the logs of your XOrg server which can be in various places, usually somewhere in your home directory in a hidden directory, or possibly in '/var/log/'. See the Arch Wiki documentation on XOrg for more details.
Finally, another potential source of video problems can be related to configurations found in GRUB. For more details on this, check the next session.
GRUB
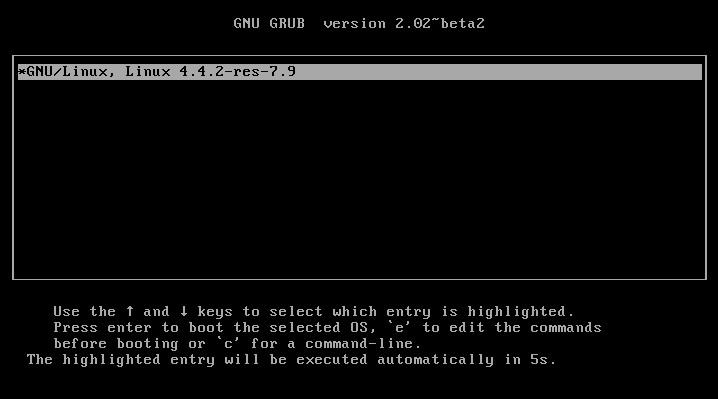
Understanding what GRUB is and what it does can be very helpful when debugging hardware problems with Linux. GRUB is a bootloader which means that it runs before any part of the operating system runs. GRUB can also define various settings that can influence the way that your computer interacts with the hardware. For example, a few common settings you might want to configure yourself are the 'nomodeset', 'splash' and 'quiet' options that were mentioned above.
The 'nomodeset' option controls whether certain graphical display options (such as screen resolution, colours, etc) are handled inside the Linux kernel itself, or externally inside a video driver. Depending on whether you enable kernel mode setting or not, this can affect the functionality of any rich graphical displays. This option is important for debugging because disabling kernel mode setting may or may not lead to better results.
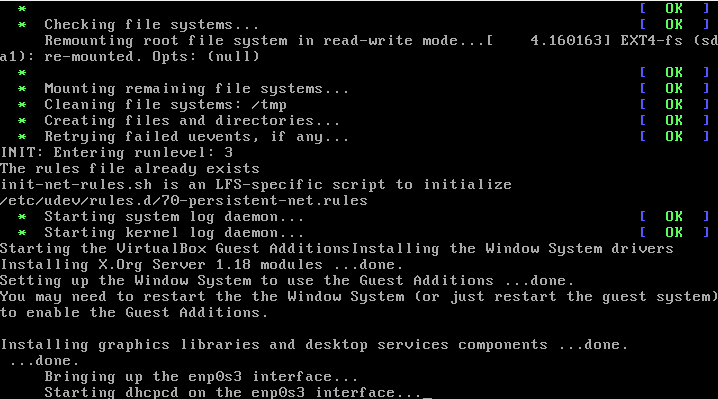
The 'quiet' option controls whether certain useful information about the success (or failure) of the boot process and kernel loading is printed to the screen. Here is an example of what this information looks like:
The 'splash' option controls whether you see the 'splash' screen or not. The splash screen is the part of the boot process where you might be presented with a nicely polished logo of the computer's distributor, or the OS distribution logo. Non-technical users would usually prefer this screen over seeing all the technical information that gets printed with the 'quiet' option is not present. You can read more about nomodeset, quiet and splash here. The following link will provide you with more information on how to change these boot options. Be careful! If you mess up your grub configuration, you might not be able to boot back into your OS!
Conclusion
In this article, we've reviewed a few commands and files that can be useful for debugging hardware-related issues in Linux. Most of what we've discussed here only scratches the surface. Most of the details and options of the commands mentioned here have been omitted to prevent this article from getting too long. Hopefully you've found some useful topics for further study!
 A Surprisingly Common Mistake Involving Wildcards & The Find Command
Published 2020-01-21 |
 Buy Now -> |
 A Guide to Recording 660FPS Video On A $6 Raspberry Pi Camera
Published 2019-08-01 |
 The Most Confusing Grep Mistakes I've Ever Made
Published 2020-11-02 |
 Use The 'tail' Command To Monitor Everything
Published 2021-04-08 |
 An Overview of How to Do Everything with Raspberry Pi Cameras
Published 2019-05-28 |
 An Introduction To Data Science On The Linux Command Line
Published 2019-10-16 |
 Using A Piece Of Paper As A Display Terminal - ed Vs. vim
Published 2020-10-05 |
| Join My Mailing List Privacy Policy |
Why Bother Subscribing?
|