D3 Visualization Framework
2015-04-21 - By Robert Elder
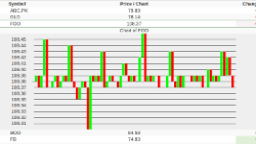
d3.js is another javascript framework I've heard a lot about, so I've resolved to get a demo up and running by 6pm today. This particular framework supports a number of different types of visualizations. D3 seems to focus on building custom geometric and geographical visualizations. Additionally, it also supports a number of standard chart types like histograms and pie charts.
The above demo is adapted from the example located here. One of the first things I noticed about this framework is that it seems geared more toward lower level drawing operations. A few other libraries that I've used seem to be just about throwing data into them and seeing a result. This would give you much more flexibility to create unique visualizations, but would obviously require a bit more thought if you wanted to master this framework.
 Amazon Cloud Servers For Beginners: Console VS Command-Line
Published 2017-03-20 |
 Buy Now -> |
 A Technical Review Of Adding Support For Google's AMP Pages
Published 2016-11-22 |
 A Review of the react.js Framework
Published 2015-02-16 |
 Learning Laravel and angular.js
Published 2015-02-06 |
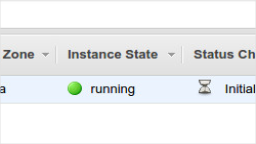
 A Weird Old Tip About EC2 Instances
Published 2015-02-07 |
 Silently Corrupting an Eclipse Workspace: The Ultimate Prank
Published 2017-03-23 |
 XKCD's StackSort Implemented In A Vim Regex
Published 2016-03-17 |
| Join My Mailing List Privacy Policy |
Why Bother Subscribing?
|